In the second half of 2023, our sustainability webinar series walks step-by-step through the GHG Protocol. Aletta Boshoff and Dylan Byrne summarise the key messages from the second part of our event, ’GHG Protocol - Measuring Scope 1 emissions’.
Now that you understand the difference between Scope 1, 2 and 3 from the first part of our event, let’s look at Scope 1 in more detail.
Scope 1 in five steps
We recommend the following five-step process when identifying and calculating Scope 1 emissions:

(click to open full size in new window)
Involving an expert in this process, whether an engineer, carbon accountant, production expert or environmental scientist, can be important because the emissions calculation is not always clear cut.
Step one – Identify the sources of emissions
Scope 1 emissions are generated by things that happen in your production processes or on your property that you own or control. They include emissions from:
- Stationary combustion
- Mobile combustion
- Fugitive emissions
- Process emissions (from physical or chemical processes).
Stationary combustion
Stationary combustion is the burning of fuel in stationary sources such as boilers, furnaces, turbines, heaters, BBQs and generators to create energy or heat on-site.
Mobile combustion
Mobile combustion, on the other hand, is the combustion of fuel in a mobile device, such as trucks, trains, ships, airplanes, buses, cars, etc.
Fugitive emissions
Fugitive emissions are released from equipment leaks such as from cooling towers, methane (CH4) from natural gas pipelines, hydrofluorocarbons (HFCs) from air conditioning and refrigeration, and CH4 from mining operations.
Process emissions
These arise from manufacturing or processing chemicals and materials (e.g. cement or aluminium) as well as from waste processing.
Step two – Select calculation approach
There are three calculation approaches for collecting emissions data:
- Direct measurement of emissions
- Stoichiometric calculations, such as the mass balance approach which measures which elements enter and leave the system
- Estimations (the most common approach) involves multiplying activity data by an appropriate emissions factor.
Step three – Collect data and choose emissions factors
It is best to use primary data rather than secondary or tertiary data to calculate Scope 1 emissions. The following are examples of primary data for Scope 1 emissions:
- Stationary combustion – consumption in litres or cubic meters of purchased fuel (LPG or diesel)
- Mobile combustion – consumption in litres of purchased fuel (petrol or diesel)
- Fugitive emissions – by kilogram or air conditioning resupply units due to leakage (from maintenance records). There are four steps to gathering activity data for fugitive emissions. To find out more watch this webinar.
An example of secondary data for mobile combustion is mileage (kilometres) and car type (large, medium, small). Therefore, when collecting emissions data for stationary combustion, use primary data such as fuel consumption instead of tertiary data such as the dollar amount spent on fuel. Similarly, for mobile combustion, use primary data such as fuel consumption of various fuel types, which is more accurate than secondary mileage and car type data, and also more accurate than tertiary data such as the total dollar spend.
Primary data is harder to obtain because it is not usually stored within accounting systems, and entities will need to develop systems to record this information in real-time.
If using primary data, you need to perform completeness checks to ensure, for example, that all fuel quantities have been captured in your calculations. This could involve dividing the total dollar value of fuel spent in the general ledger by average price per unit of fuel and comparing that to the quantities identified in your primary data. We would not expect to see significant differences if your primary data is complete.
It is also better to use disaggregated data for each of your facilities because this will help you to compare emissions between facilities and make improvements.
The diagram below illustrates how activity data from the four categories of emissions identified in Step one is converted into carbon dioxide equivalents (CO2e) of emissions.
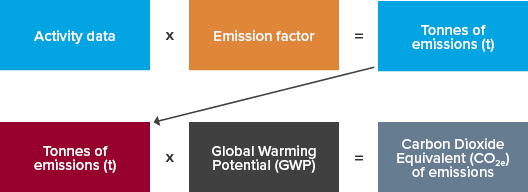
(click to open full size in new window)
Each activity has an Emissions Factor that is calculated and published by the government each year in the Annual Greenhouse Accounts and is readily available. Once you have calculated the tonnes of emissions, they need to be converted into CO2e by multiplying by its global warming potential (GWP) - this brings all emissions into a standardised CO2e emission.
Step four – Apply calculation tools
Here we rely on the GHG Protocol for calculation tools and guidance which are available free of charge. Software companies also have tools available to perform the calculations. Using a tool rather than Excel can make calculations easier and less prone to human error.
Step five – Roll-up data to corporate level
Your calculations complete, the last step is to roll-up all the data at a corporate level. That is, you need to aggregate all your data within your organisational boundary.
Find out more
Want to understand more about the GHG Protocol? Register now for the remaining events in the webinar series. Our 27 September webinar looks at measuring Scope 2 emissions.
If you need a hand in identifying and measuring your Scope 1 emissions, our national sustainability team can help. Contact us today.