


National Leader, Transaction Advisory Services

During the 2025 financial year (FY25), the Australian economy showed signs of stabilisation following two years of monetary tightening. While the Reserve Bank of Australia (RBA) maintained a cautious stance, interest rates decreased for the first time in five years allowing businesses and investors to recalibrate. However, this was offset by geopolitical factors which caused worldwide market volatility at the beginning of 2025.
This survey tracks the listed Australian property industry over FY25 by ranking the S&P/ASX 200 A-REIT Index trusts (A-REIT Index) using key financial and investment indicators.
Our analysis reveals that in FY25, the A-REIT Index delivered a total return of approximately 10.3 per cent, a decrease of 9.6 percentage points from FY24. In addition, it only slightly exceeded the S&P/ASX 200 Index return of 10 per cent. Sector performance was mixed: retail and diversified A-REITs delivered strong returns, office REITs remained weak, and industrial A-REITs turned negative after years of outperformance.
The A-REIT Index began FY25 with cautious optimism, buoyed by stabilising interest rates and exceeded the S&P/ASX 200 Index by 7.3ppts by the end of September 2024. However, this plateaued up until January 2025, before decreasing sharply in the period to April 2025 to negative returns of 6.1 per cent, fuelled by geopolitical uncertainty. In the final quarter of FY25, the returns have recovered to the levels seen in September 2024.
Despite the challenges, our findings have uncovered pockets of strength over the past year, with three pivotal themes that we anticipate will continue to exert influence on the performance of A-REITs throughout the current financial year.

FY25 marked a turning point for the A-REIT sector. Asset valuations began to show signs of stabilisation, underpinned by a more predictable macroeconomic environment. The RBA efforts to rein in inflation and maintain steady interest rates contributed significantly to this newfound stability. As inflationary pressures eased and monetary policy steadied, investor confidence began to return, providing a firmer foundation for A-REITs to recalibrate and consolidate.
In tandem with valuation stabilisation, gearing levels across the sector also showed modest improvement. The RBA’s interest rate adjustments throughout the year facilitated a marginal reduction in leverage ratios, offering A-REITs greater financial flexibility and resilience. This shift not only reflects prudent capital management but also positions the sector to better navigate future market dynamics. Overall, FY25 has signalled a cautious but encouraging recovery phase for A-REITs, with stabilising fundamentals suggesting a more balanced outlook ahead.
This is in contrast with FY23 and FY24, which were marked by significant headwinds. In these financial years, asset valuations declined amid aggressive interest rate hikes by the RBA, aimed at curbing inflation. These monetary tightening measures, combined with heightened market volatility and global geopolitical uncertainty, placed considerable strain on the sector. Gearing levels also rose during this time, as higher debt costs and reduced asset values challenged capital structures and investor confidence.
The S&P/ASX A-REIT 200 Index returned 10.3 per cent in FY25, slightly outperforming the broader market index (ASX 200 Index) by 0.3 percentage points by year end. The ASX index mostly tracked the broader market index throughout the year, with the exception of a large discrepancy between the two at September 2024.
Figure 1: S&P/ASX A-REIT 200 Accumulation Index and S&P/ASX 200 Index VS S&P/ASX 200 Volatility Index
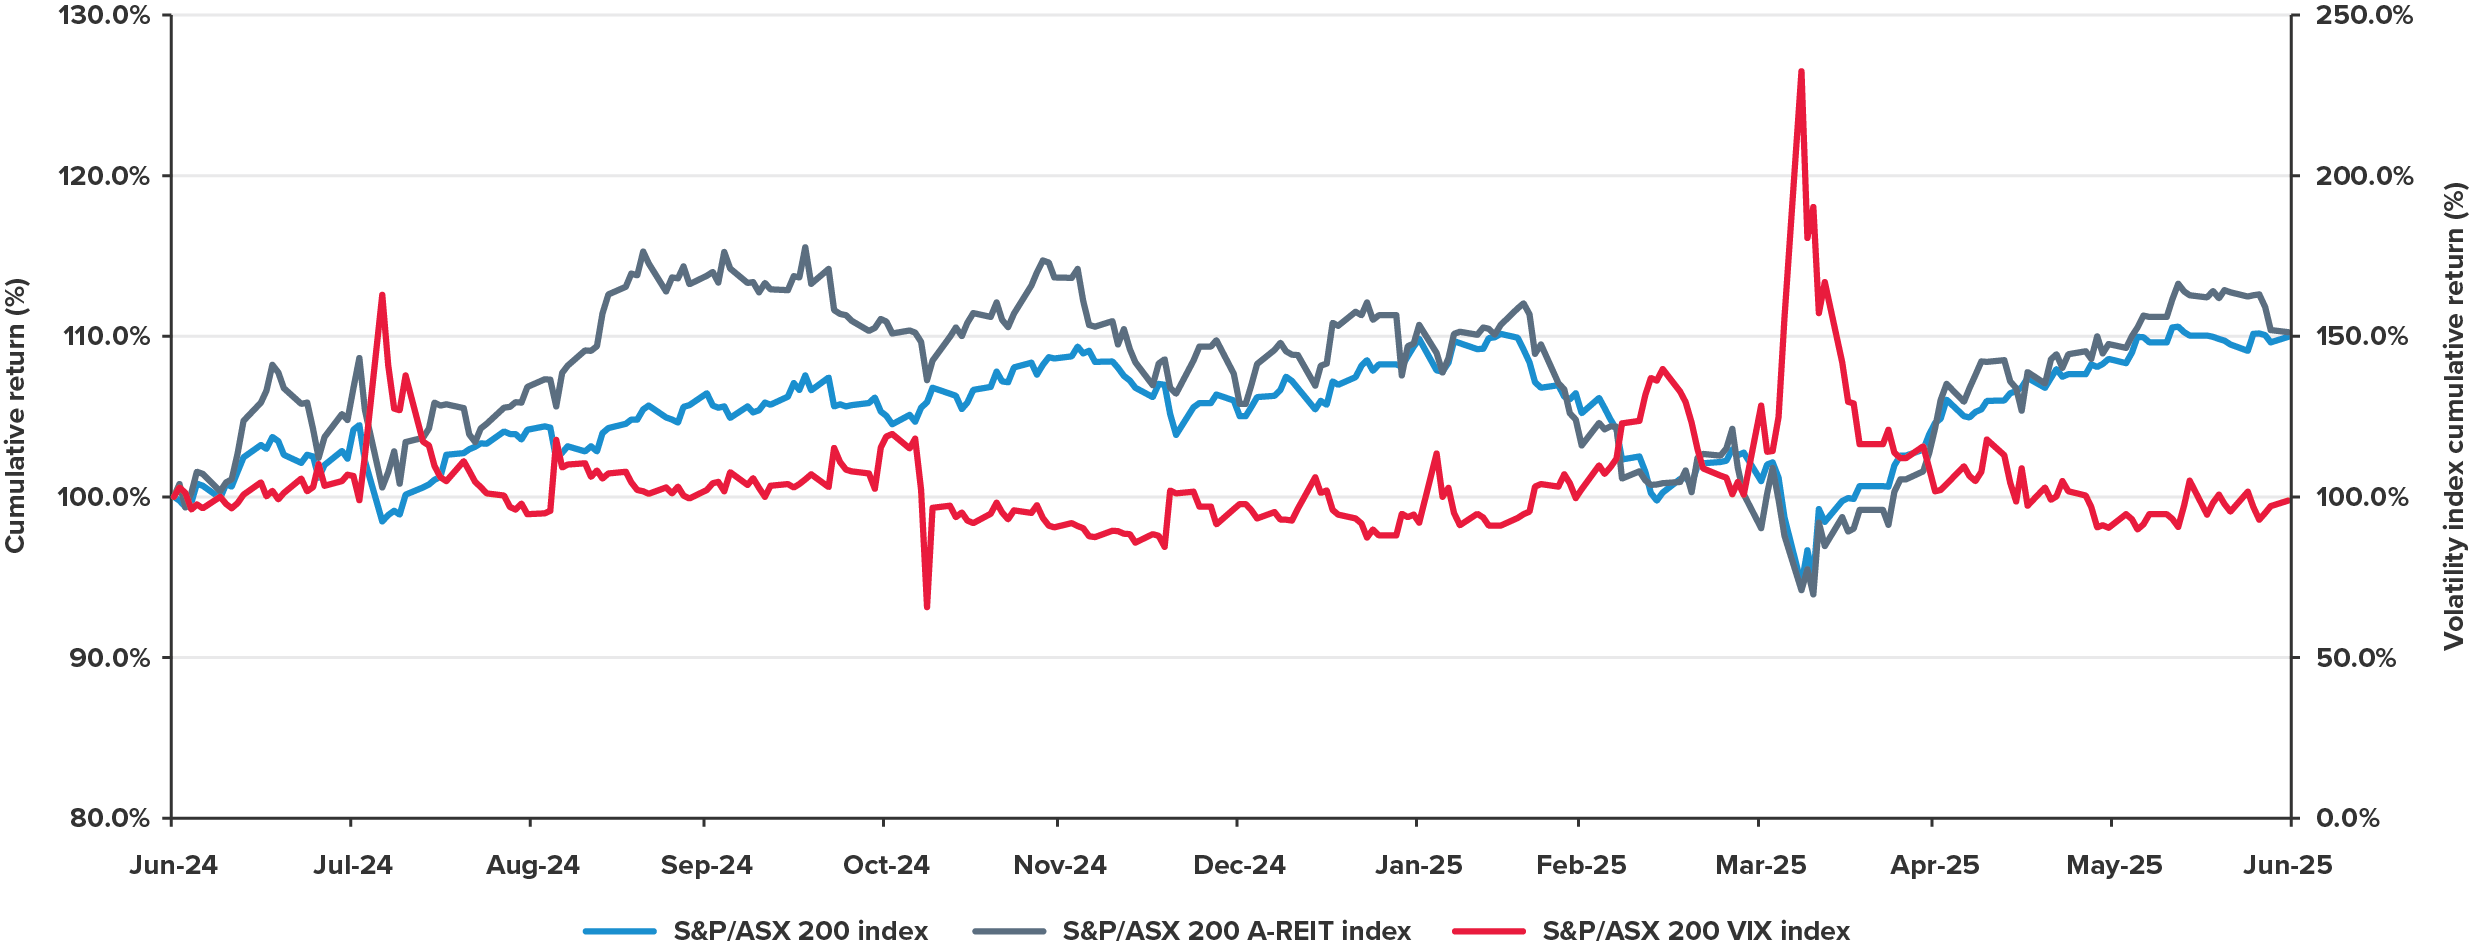
Source: CapitalIQ and BDO analysis
Figure 2: 2025 A-REIT sector price returns
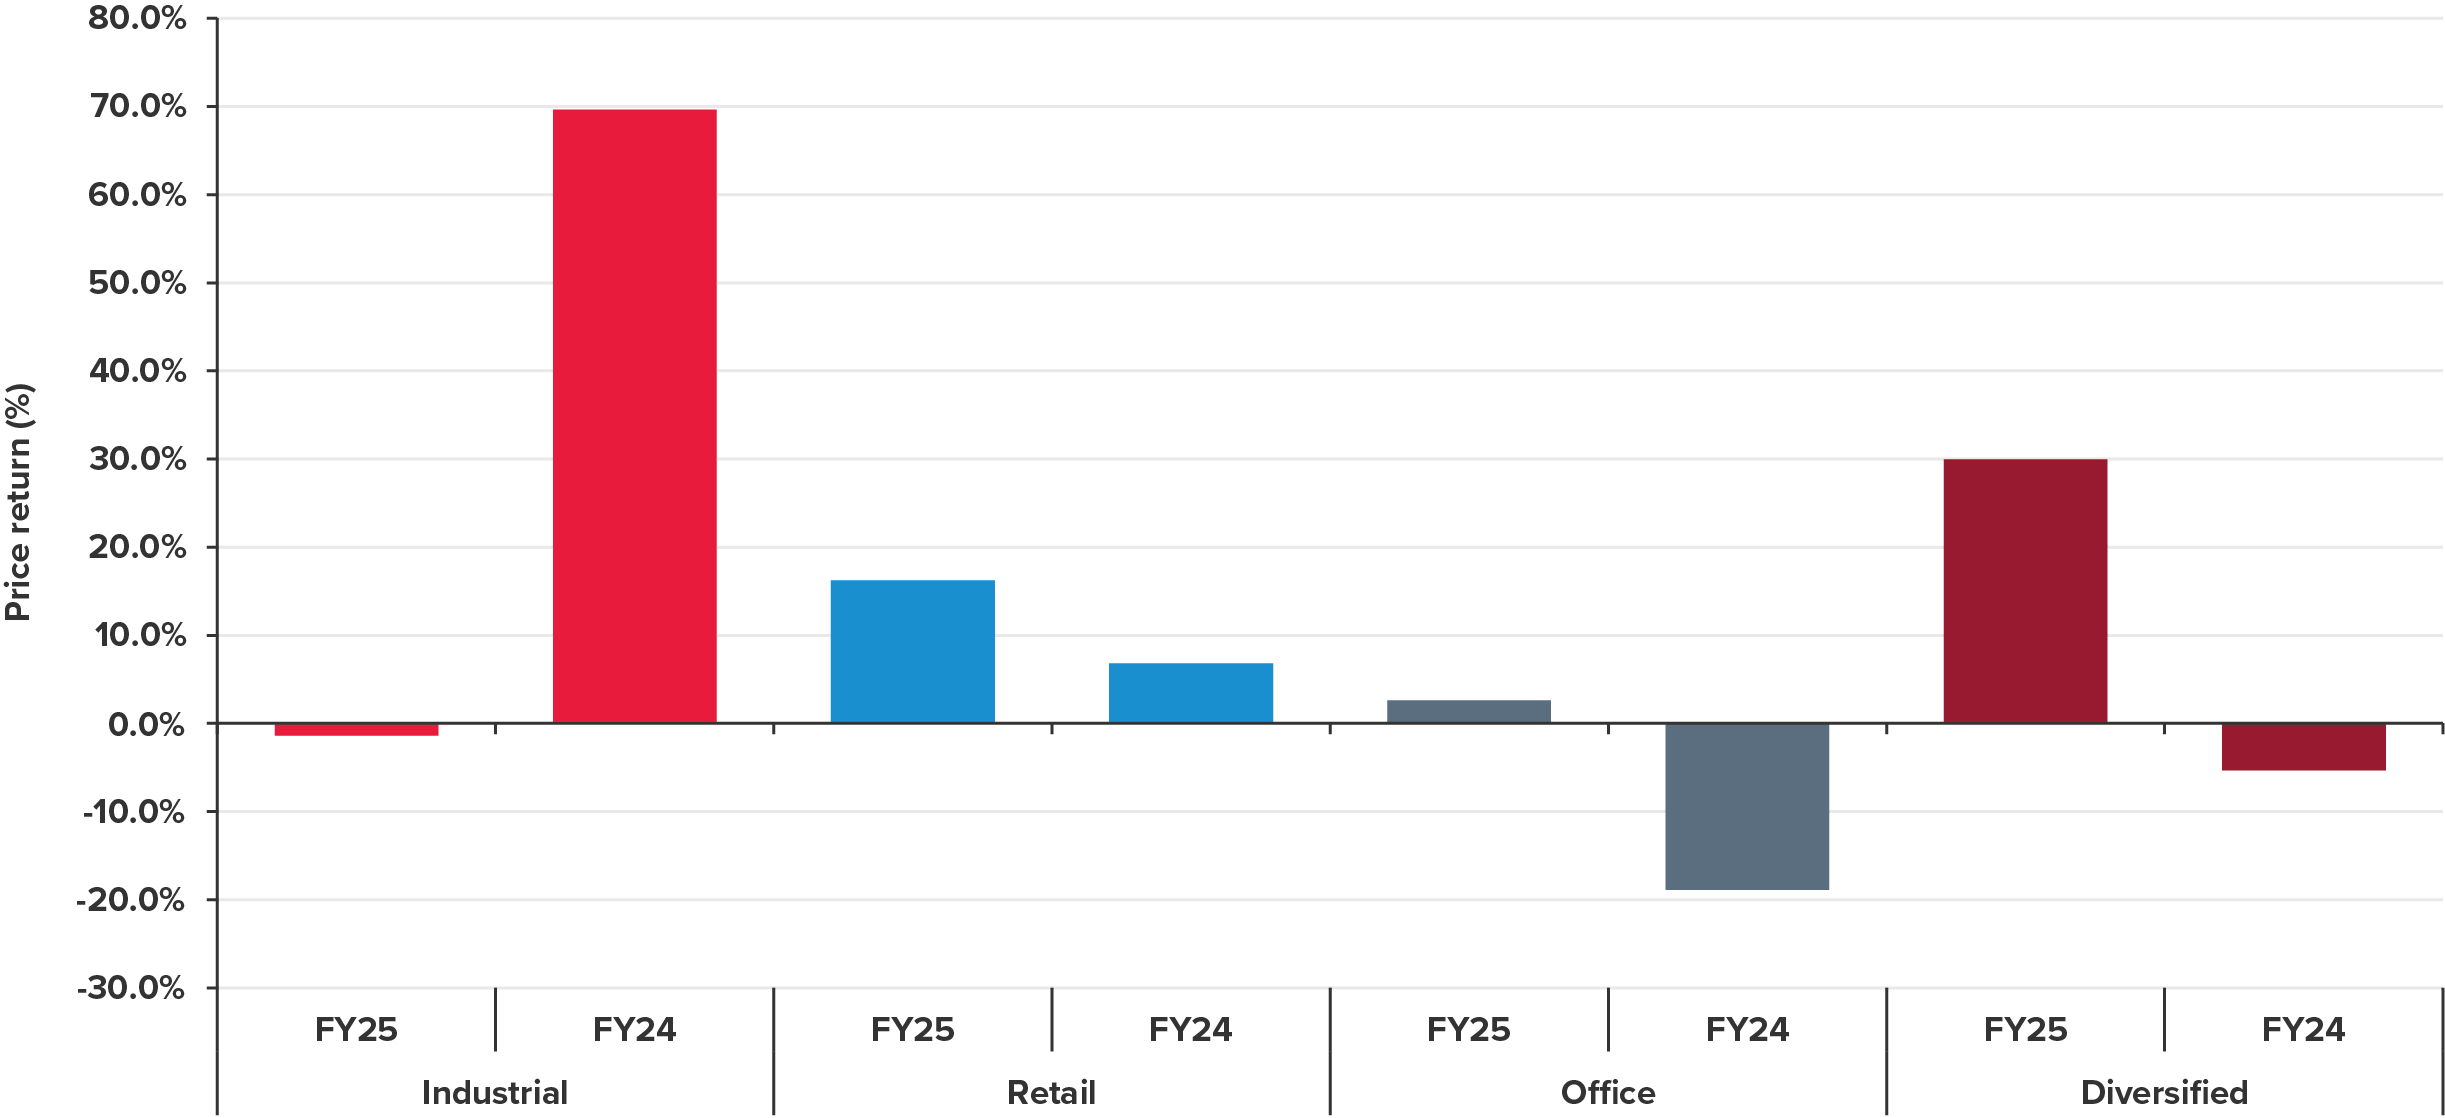
Source: CapitalIQ and BDO analysis

Top three:
On the back of an exceptional FY24, the industrial sector suffered a setback in FY25 with negative returns of 1.4 per cent. The Index remained largely stable over the year, with notable declines between January and April 2025, before recovering to previous levels by the end of the financial year.
Following a period of rapid expansion, the industrial real estate sector is transitioning toward a more normalised state. While underlying demand remains robust, a slight uptick in vacancy rates from 2.5 per cent in FY24 to 2.8 per cent in 1H25 has contributed to a moderation in rental growth across certain markets. Although vacancy levels continue to be relatively low, they have risen compared to pre-pandemic benchmarks. Net effective rental growth is decelerating, particularly in outer metropolitan areas, and elevated construction costs are increasingly affecting development viability. Despite the sector no longer experiencing accelerated rental growth and low returns in the financial year, its strong fundamentals and sustained demand continue to underpin its resilience as an investment class.

Top three:
The retail sub-sector was the second highest returning sub-sector, with the Index increasing in value by 16.2 per cent in FY25 compared to 6.8 per cent in FY24.
Following challenges and subdued returns in previous years, the Australian retail sector has shown signs of renewed strength. Following an extended period of subdued per capita spending, both discretionary and non-discretionary expenditure is exhibiting consistent growth. The continued recovery in real household disposable income is anticipated to support stronger growth in consumer spending. This rebound in household income is driven by several key factors, including easing inflationary pressures, wage growth exceeding the rate of inflation, a transition to lower interest rates, and targeted cost-of-living relief measures. Collectively, these dynamics are expected to enhance household purchasing power and stimulate broader consumer activity.
A constrained pipeline of new shopping centre developments has contributed to relatively low vacancy rates, while urban retail precincts are experiencing uplift from increased office occupancy and a rebound in tourism. As a result, investor sentiment toward the sector has improved markedly, with well-positioned assets demonstrating strong tenant demand and renewed viability as investment opportunities.

Top three:
Following consecutive years of poor performance and negative returns, the office sub-sector has seen a slight improvement in FY25, with a modest annual return of 2.6 per cent.
The office sub-sector is thought to have bottomed-out in FY24 and is beginning to show signs of optimism, albeit small. Office space demand is expected to strengthen in line with population growth and the continued resurgence of office occupancy. In addition, new supply is anticipated to contract as the pre-COVID development pipeline concludes in 2025, with emerging projects facing feasibility constraints. However, with vacancy rate at 15.2 per cent nationally and the Victorian Government proposing work from home rights being written into law, there still remains significant challenges on the horizon for the sector.
Aspen Group Limited (ASX:APZ) is a leading provider of quality accommodation in the residential, retirement, and short-stay sectors. The group holds over 5,000 sites and dwellings across Australia valued at c.$600 million.
Highlights:
Annual report insights:
Aspen Group Limited’s FY25 performance was driven by strong growth in both its rental and development segments. Rental income rose due to a larger pool of dwellings, higher occupancy, and competitive, affordable rents. Development profits surged with increased sales of new lifestyle homes and residential land lots, supported by acquisitions and a robust pipeline. Operational efficiency improved margins, while capital recycling and reduced gearing strengthened the balance sheet. The business benefited from resilient demand for affordable accommodation, disciplined cost management, and favourable market conditions. EBIT margin remained strong at 79.4 per cent.

Charter Hall Group (ASX:CHC) is a leading Australian REIT which was founded in 1991. It manages a diverse portfolio of high-quality assets across Australia, with a strong focus on sustainable and long-term value creation. The company operates through various managed funds and partnerships, offering institutional, wholesale, and retail investor opportunities in commercial property. Charter Hall Group is recognised for its strong relationships with tenants and investors, strategic asset management, and its commitment to environmental, social, and governance (ESG) principles, which underpin its ongoing success in the real estate sector.
Highlights:
Annual report insights:
Charter Hall Group’s FY25 performance was driven by growth in funds under management (FUM), strong operating earnings, and disciplined capital management. Charter Hall Group benefitted from sector diversification across industrial, office, retail, and social infrastructure, with high occupancy rates and long weighted average lease expiries. Development activity and acquisitions supported portfolio expansion, while a focus on sustainability and customer partnerships enhanced resilience. Operating earnings rose 7.3 per cent to $385 million, with a 20.8 per cent return on contributed equity.

The AIMS Property Securities Fund (APW) is a diversified real estate securities fund, investing across a wide range of unlisted and listed property securities. It has exposure to domestic and overseas commercial real estate through specialist property investment managers.
Highlights:
Annual report insights:
APW’s strong FY25 performance was driven by substantial unrealised gains on financial assets, particularly from its holdings in AIMS APAC REIT, AIMS Growth Investment Fund, and related vehicles. Conservative, long-term investment strategies, zero gearing, and prudent asset selection underpinned results. APW benefitted from market recovery, interest rate easing, and disciplined cost control. Diversification across listed and unlisted property securities reduced risk and volatility. The unit price rose 87.5 per cent, with NTA per unit up 31.8 per cent.

Goodman Group (ASX:GMG) is a global provider of essential infrastructure, focusing on owning, developing, and managing logistics and data centre properties in urban locations. Goodman Group operates across five continents and 15 countries, with a portfolio valued at $85.6 billion as of 30 June 2025. Goodman Group is committed to sustainability, innovation, and community engagement, aiming to deliver high-quality infrastructure solutions that support the digital economy's growth.
Highlights:
Annual report insights:
Goodman Group’s FY25 performance was driven by strong development activity, high-quality assets in strategic urban locations, and robust demand for logistics and data centre infrastructure. Operating profit rose 12.8 per cent to $2.31 billion, with operating EPS up 9.8 per cent. High occupancy (96.5 per cent), rental growth, and disciplined capital management underpinned results. Goodman Group’s focus on large-scale data centre developments (57 per cent of WIP), ongoing investment in Partnerships, and a $4.0 billion equity raising supported growth.

Scentre Group (ASX:SCG) is an Australian and New Zealand shopping centre and retail company that operates under the Westfield brand. The Group owns and operates 42 Westfield destinations, 37 of which are in Australia and New Zealand, boasting an asset under management (AUM) of $50.7 billion. Of that $50.7 billion, the Group ownership interest equates to $35 billion.
Highlights:
Annual report insights:
Scentre Group’s performance for the half-year ended 30 June 2025 was driven by increased customer visitations (up 3 per cent), high portfolio occupancy (99.7 per cent), and strong business partner sales ($13.8 billion, up 2.9 per cent). Net operating income grew 3.7 per cent to $1,042.5 million, supported by specialty rent escalations and positive lease spreads. Strategic redevelopments at Westfield Sydney, Bondi, and Southland enhanced offerings and engagement. Scentre Group’s focus on activating destinations and leveraging strategic land holdings underpinned growth, while disciplined capital management and joint ventures provided financial flexibility and capacity for future development.

Charter Hall Social Infrastructure REIT (ASX:CQE) is the largest Australian property trust investing in social infrastructure properties within Australia and New Zealand. They currently hold 328 properties with a gross asset value of $2.1 billion.
Highlights:
Annual report insights:
Performance was driven by active portfolio curation, recycling lower-yielding assets into higher-yielding, long WALE social infrastructure properties. Net property income rose to $109.0 million, with stable property expenses and reduced management fees supporting margins. Portfolio yield increased from 5.2 per cent to 5.4 per cent, aided by strong rent reviews (WARR 4.2 per cent) and 67 per cent of income subject to fixed increases averaging 3.0 per cent. Statutory profit rebounded to $71.0 million, boosted by $28.8 million in valuation gains. Debt refinancing extended maturity and increased hedging, helping manage finance costs despite higher interest rates, while sustainability initiatives enhanced long-term value.

The GPT Group (ASX:GPT) is an owner, manager, and developer of retail, office, and logistics assets, with a portfolio of 10 shopping centres, 27 office buildings, and 69 logistics assets across Australia. Established in 1971, the GPT Group has grown to a portfolio of more than $34 billion in assets. As at 30 June 2025, the portfolio’s occupancy rate was 98.5 per cent.
Highlights:
Annual report insights:
Performance was driven by increased funds from operations (FFO) supported by higher net property income in retail and office, strong co-investment returns, and growth in management operations. Retail and office segments saw like-for-like net property income growth underpinned by positive leasing spreads, fixed rental increases, and improved occupancy. Portfolio optimisation, including asset sales and acquisitions, enhanced capital efficiency. Despite higher finance costs, disciplined capital management maintained gearing at 30.7 per cent. Valuation gains and stable occupancy (98.5 per cent) further supported robust financial performance.

Charter Hall Retail REIT (ASX:CQR) is the leading owner of convenience retail shopping centres and long WALE assets in Australia and New Zealand with a total portfolio value of $4.8 billion. The portfolio is comprised of 699 properties with an occupancy of 98.9 per cent. Further, Charter Hall Retail REIT employs an active asset management strategy and enhances portfolio quality through engaging with major tenants.
Highlights:
Annual report insights:
Charter Hall Retail REIT’s FY25 performance was driven by higher net property income, significant property revaluations, and active portfolio management. Statutory profit surged due to $139.6 million in net revaluation gains, while operating earnings fell 7.2 per cent to $147.5 million, mainly due to increased finance costs. The REIT benefited from inflation-linked rental income and interest rate hedging, but rising interest rates and debt costs weighed on results. Strategic acquisitions and disposals, plus the creation of the Convenience Retail Fund, supported asset growth. The portfolio’s resilience stems from exposure to non-discretionary retail and disciplined capital management.

GDI (ASX: GDI) is a fully integrated, internally managed commercial property investment firm, specialising in identifying and executing acquisition opportunities, as well as owning, managing, developing, refurbishing, leasing, and syndicating real estate assets. As of June 2025, GDI has 23 AUM totalling $1.25 billion.
Highlights:
Annual report insights:
GDI Property Group’s FY25 performance was driven by strong leasing activity, strategic asset management, and disciplined capital allocation. Key factors included securing over 32,000sqm in new and renewed leases, increasing portfolio occupancy to 88.2 per cent, and achieving 22 per cent growth in Property Division FFO. Successful asset sales generated liquidity, while the flagship WS2 development and adaptive reuse strategies enhanced value. The Funds Management Division benefitted from disposal fees and distributions. Stable returns from the diversified Co-living JV and prudent debt management further supported results, with Perth’s robust office market underpinning growth.

The US Masters Residential Property Fund (ASX: URF), was established in 2011 to provide investors with access to the US residential real estate market. It stands as the largest Australian-listed property trust focused primarily on investing in freestanding and multi-tenant residential properties within the New York metropolitan area. As of 30 June 2025, the Fund’s portfolio comprises 463 housing units spread across 254 freestanding properties, with a total gross asset value of approximately US$315 million.
Highlights:
Annual report insights:
Performance was driven by an accelerated asset sales program, with US$119 million in closed sales in the half-year to 30 June 2025 and a strong pipeline targeting US$200–225 million for the remainder of year. The Group benefitted from strategic vacancy management and rental increases in late 2024, supporting sales momentum. Despite a fair value decrement of US$9.2 million, mainly in New York, pricing and activity remained firm in New Jersey. Capital management focused on distributions and buybacks, while a change to a US C-Corp structure reduced deferred tax liabilities, supporting post-tax profitability.


We have seen a turnaround in the interest rate environment – while there is speculation around further cuts, we have seen three cuts in the 2025 calendar year, which has improved investor confidence and reduced the incremental cost of capital.
Population growth has continued, and is expected to do so over the longer-term, which creates sustained demand for real estate space across all sectors, while the consistently high cost of construction continues to constrain supply, supporting demand for existing, quality assets.
In Office, businesses are increasingly driving toward “in office” cultures, with a focus on high-quality office assets in both CBD and metro markets.
We have seen an increase in capital allocated to Queensland, which may otherwise have been centred on Victoria, as Queensland has seen sustained population growth and significant infrastructure investment.
While it has been a challenging year for funds managers, investor demand has increased for active style funds management and we are pleased to have created two new funds, with both institutional partner and syndicated wholesale investor support.
With the turning of interest rates, and a somewhat ‘normalising’ macro environment, we are seeing confidence return to the sector.
We have seen elevated office asset transactions over recent months, especially in the Sydney CBD. As that supply wanes, we expect to see further opportunities in metro areas and other states – providing an attractive environment as we continue to focus on growth through our funds business.
Total shareholder returns for the ASX 300 A-REIT index were 13.8 per cent in FY25, with Growthpoint ranking in the top half, and in the FY26 year to 30 September 2025, the ASX 300 A- REIT index has returned 4.8 per cent, with Growthpoint returning 10.3 per cent as the discount to NTA has decreased.
Our focus over FY26 is continuing to maximise the value of our directly held Office and Industrial portfolio, with a focus on leasing, and generating growth through further new funds.

The past 12 months finally saw the peak and then commencement of the interest rate easing cycle. In turn, this resulted in a slight improvement in direct market liquidity and capital transactions that continue to improve, which finally has provided greater certainty to asset values and balance sheets. This has been the catalyst for improving trading prices.
The REIT market is expected to continue to improve over the next 12 months with improving trading prices across most sectors. Although interest rates have eased and are seen as a tailwind to earnings, balance sheet management will always be key and those with the least gearing (and least benefit from easing rates) will have the greatest capacity to grow earnings. Garda has divested two larger assets due to settle 1HCY25, significantly reducing gearing, and retains its high-quality, Brisbane-based industrial portfolio and is increasing its direct lending activities predominantly around SEQ with exposure to the residential and industrial sectors.
FY25 continued to test Australia’s economy and policy settings. Real GDP expanded by just 1.3 per cent over the year, well below the long-run average of 3.35 per cent, and per-capita output fell for a seventh consecutive quarter to December 2024 – extending Australia’s record per-capita recession.
Over the period, the RBA pivoted after two consecutive 25 bps cuts, trimming the cash rate from 4.35 per cent to 3.85 per cent by May 2025 — its lowest level in two years, and signalled openness to further easing as inflation pressures subsided. Headline inflation slowed sharply, with the CPI rising just 2.1 per cent over the year to June 2025, the weakest annual outcome since March 2021 and down from 3.1 per cent a year earlier.
In the rental market, supply constraints persisted despite some easing in growth. National rents climbed 3.4 per cent year-on-year to June 2025, while the vacancy rate ticked up slightly to 1.6 per cent, still less than half the pre-COVID average and keeping affordability stretched for many households. Policymakers continued to promote build-to-rent projects to bolster supply and relieve upward pressure on rents.
The softer rate environment provided a window for A-REITs to refinance and restructure debt. During the February 2025 reporting season, roughly half of listed property trusts exceeded analyst forecasts, valuations stabilised with only modest cap-rate shifts, and the sector broadly traded at a discount to NTA, setting the stage for potential M&A activity. Market pricing implies around 80 bps of further RBA easing over the next year, which should gradually lower financing costs for property investors and support new issuance.
Migration rebound and demographic shifts will be key drivers of residential demand into FY26, particularly in Sydney and Melbourne, where overseas arrivals are recovering toward pre-pandemic levels. The pipeline of purpose-built student accommodation and co-living developments is expanding, offering new avenues for yield-seeking investors and relief to tight inner-city rental markets. ESG and decarbonisation requirements are reshaping how institutional landlords manage portfolios, with green lease clauses and energy-efficiency retrofits becoming mainstream. Global capital flows into the Australian property sector have remained robust, especially from sovereign wealth funds targeting logistics, data centres, and life-science assets. Beyond traditional office and retail, alternative real-assets such as childcare centres, seniors housing, and industrial warehouses are attracting growing allocations from pension funds.

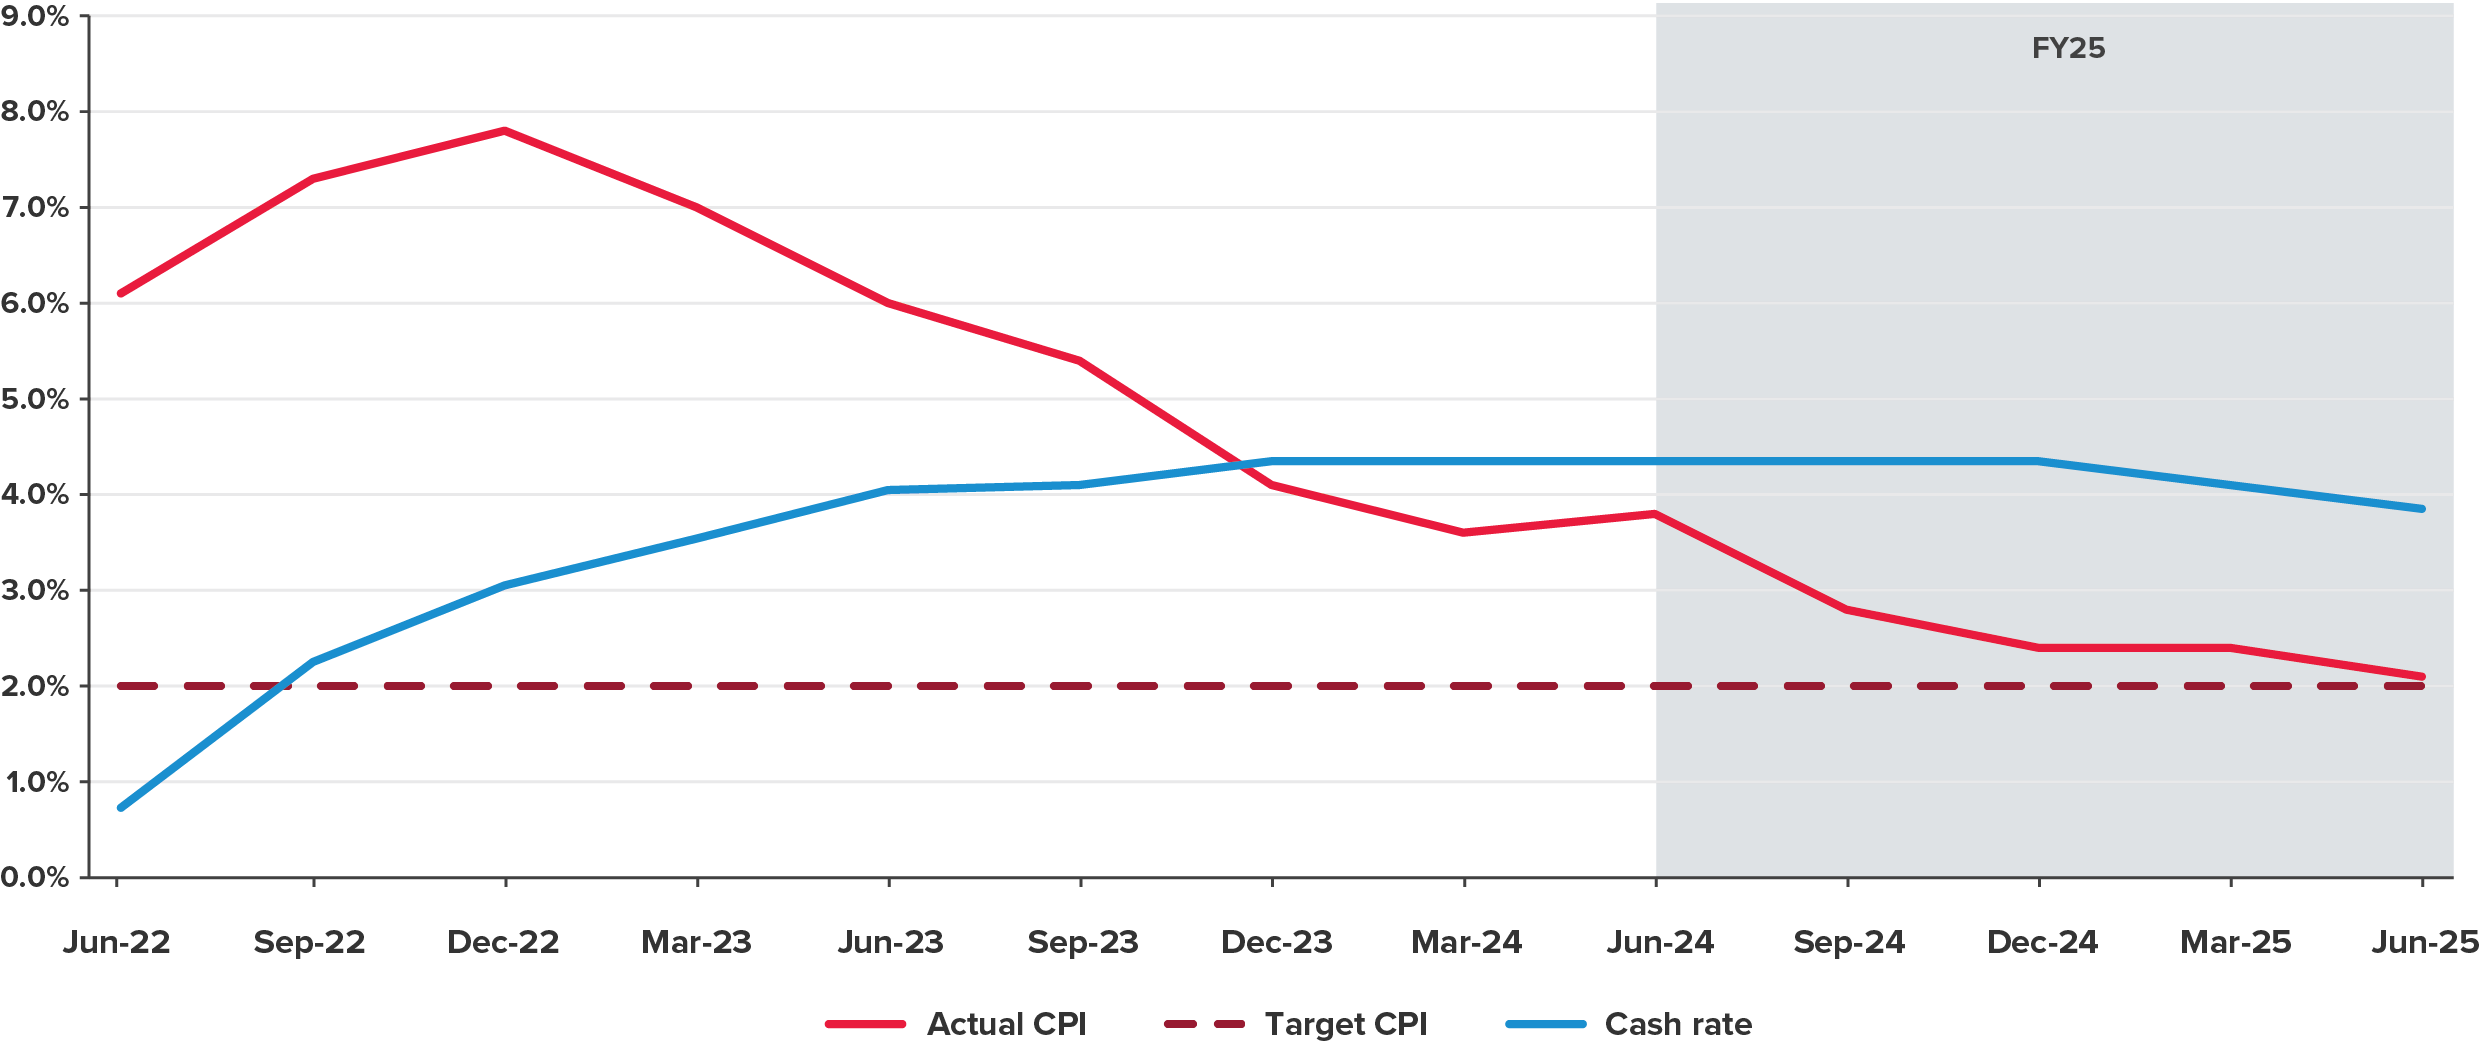
Source: Reserve Bank of Australia statistical data
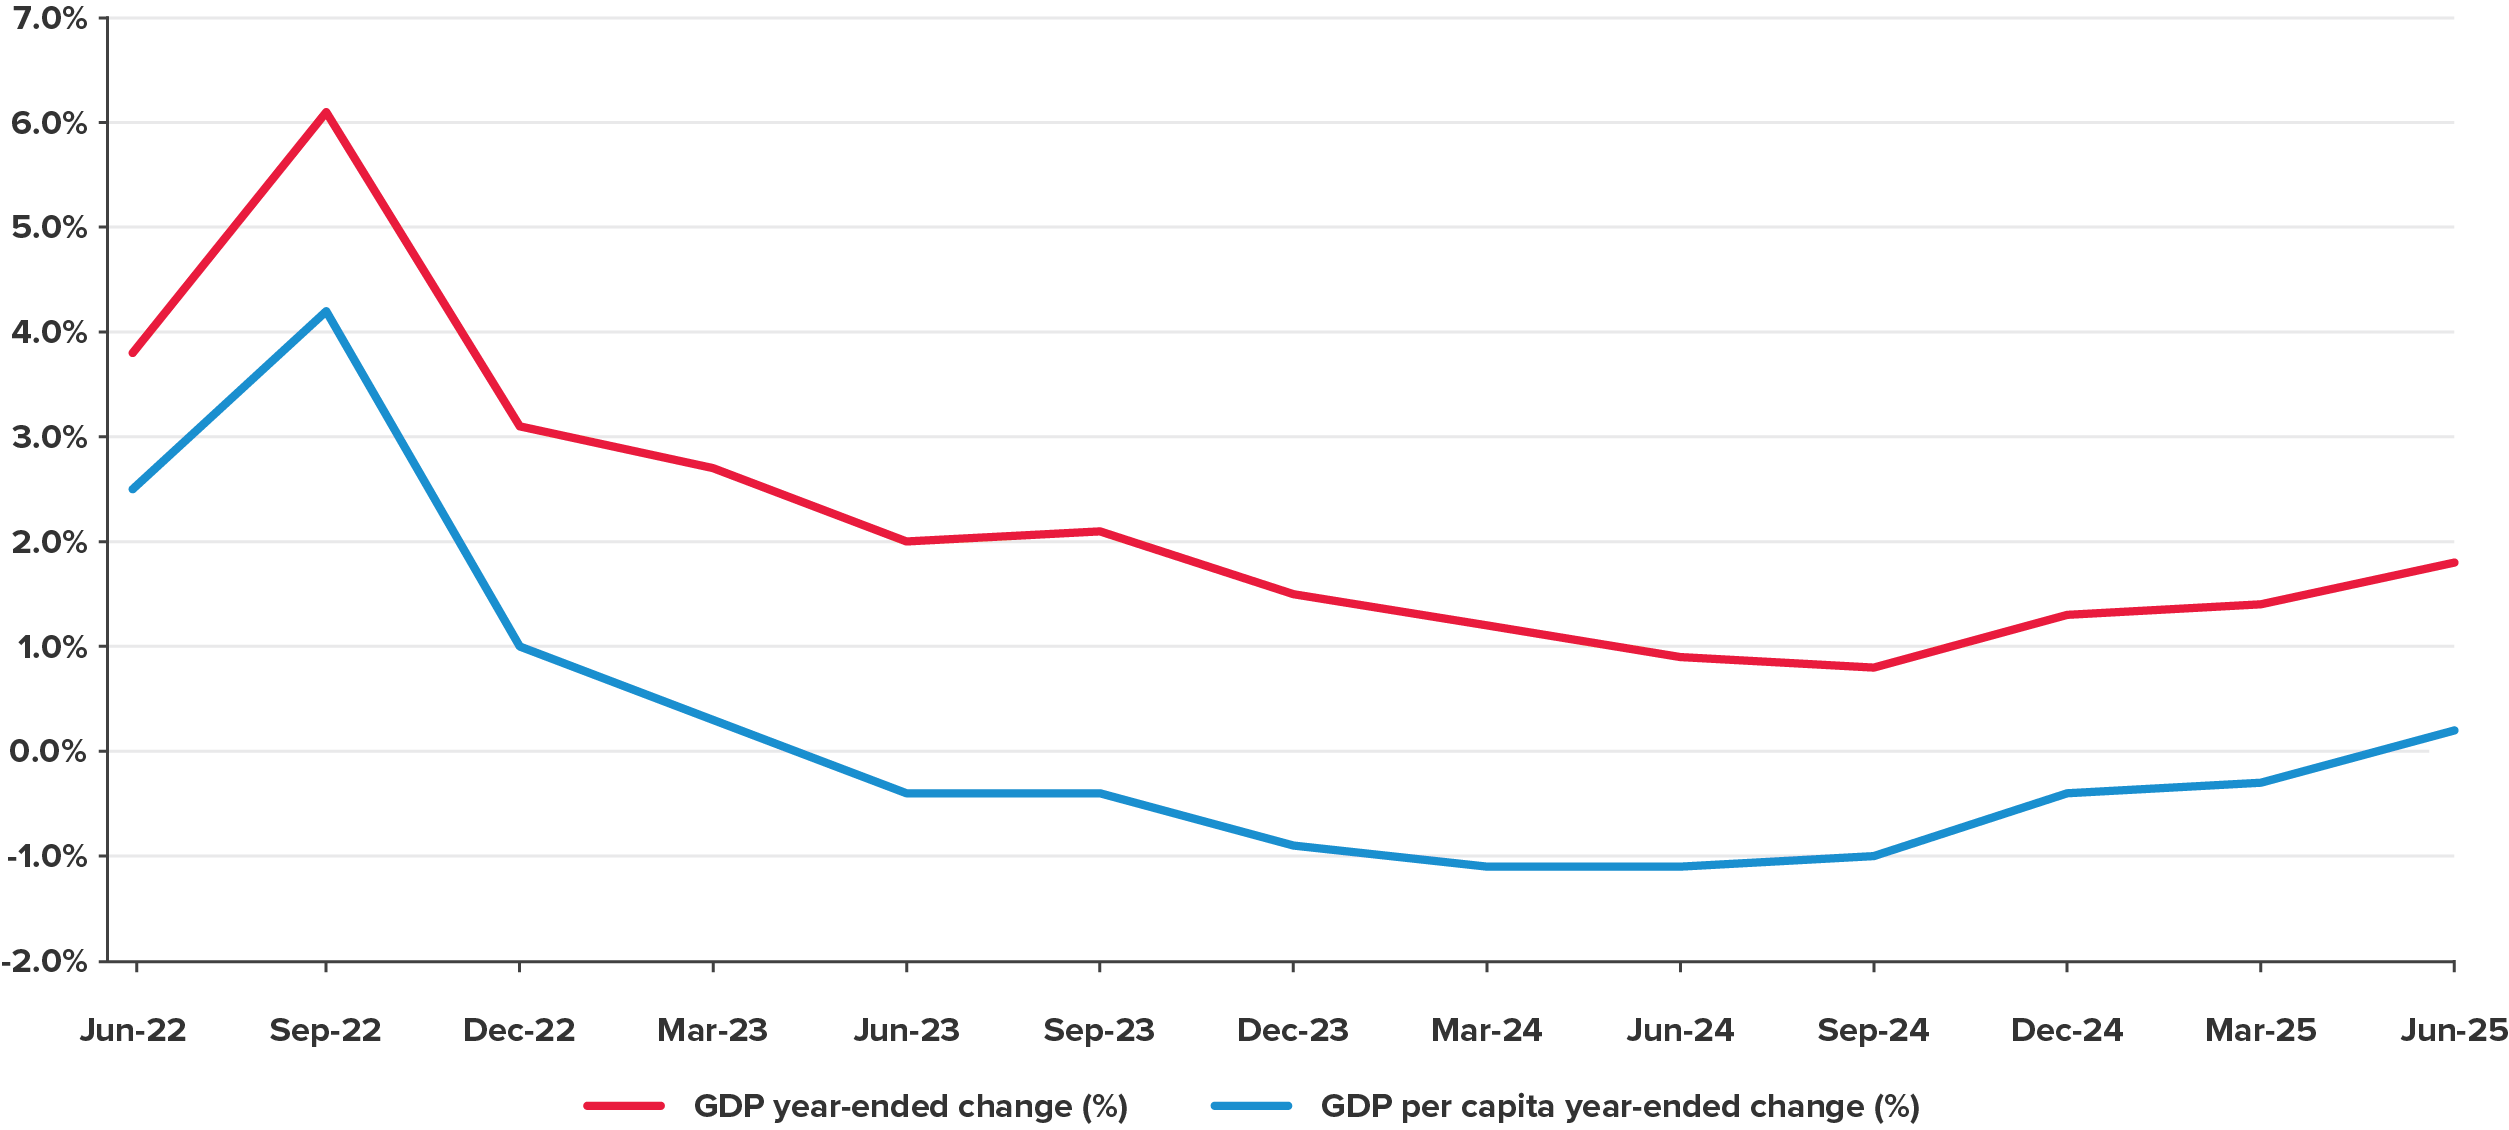
Source: Reserve Bank of Australia statistical data
A brief explanation of each criterion used to rank REITs in the 2025 survey is provided below.

For the past 31 years, BDO in Australia has been dedicated to publishing our annual A-REIT survey. Each year, we deeply value the insights and contributions from REITs across the country, as well as the engagement from our readership. Your continued support and participation are what make this survey a trusted resource in the industry. If you’d like to discuss this year’s results, or would like support with your own business, contact us today.
Find out more about our Real Estate and Construction Services.