GHG Protocol - Measuring upstream Scope 3 emissions
GHG Protocol - Measuring upstream Scope 3 emissions
In the second half of 2023, our sustainability webinar series walks step-by-step through the GHG Protocol. Aletta Boshoff and Dylan Byrne summarise the key messages from our October event, which explains how to measure upstream Scope 3 emissions.
What are Scope 3 emissions?
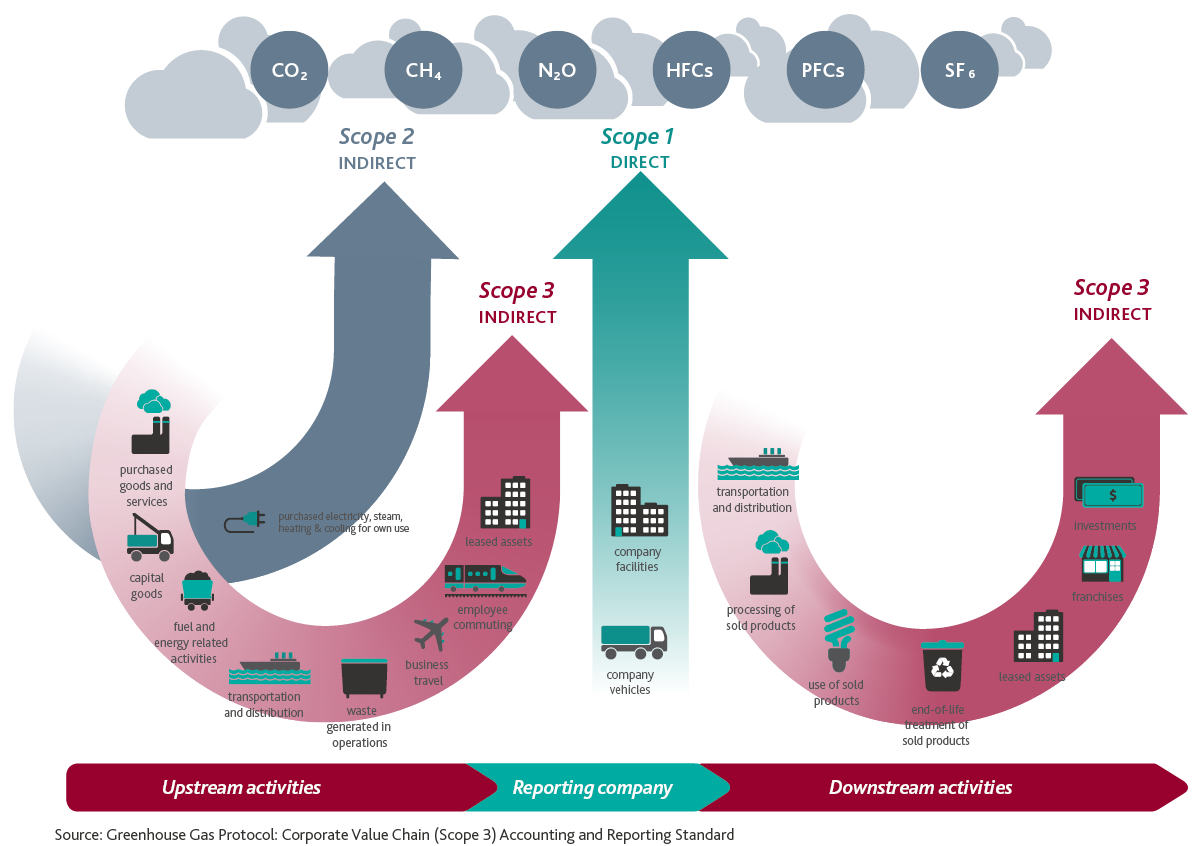
Scope 3 emissions are indirect emissions that do not arise from an entity’s Scope 2 emissions (purchased electricity, steam, heating and cooling for own use). They relate to the entity’s upstream activities if the entity reports emissions on a ‘cradle-to-gate’ basis, and also downstream activities if the entity reports on a ‘cradle-to-grave’ basis. There are fifteen Scope 3 categories, shown in the diagram below.
Identify relevant activities
When measuring Scope 3 emissions, entities might not necessarily focus on all fifteen categories to the same degree. For example, entities may focus on Scope 3 categories which:
- Are expected to have the most significant GHG emissions. This may initially involve a high-level estimation process for each category, with the aim of using more precise, labour-intensive data collection techniques for higher emission categories
- Offer the most significant reduction opportunities
- Are most relevant to the company’s business goals.
An entity must therefore apply judgment to identify its relevant activities, and document that judgment because it will need to be reported.
Table [II] in the Technical Guidance for Calculating Scope 3 Emissions outlines the criteria for identifying relevant Scope 3 activities.
| Criteria |
Description of activities |
|
Size |
They contribute significantly to the company’s total anticipated scope 3 emissions |
|
Influence |
There are potential emissions reductions that could be undertaken or influenced by the company |
|
Risk |
They contribute to the company’s risk exposure (e.g., climate change related risks such as financial, regulatory, supply chain, product and technology, compliance/litigation, and reputational risks) |
|
Stakeholders |
They are deemed critical by key stakeholders (e.g., customers, suppliers, investors or civil society) |
|
Outsourcing |
They are outsourced activities previously performed in-house or activities outsourced by the reporting company that are typically performed in-house by other companies in the reporting company’s sector |
|
Sector guidance |
They have been identified as significant by sector-specific guidance |
|
Spending or revenue analysis |
They are areas that require a high level of spending or generate a high level of revenue (and are sometimes correlated with high GHG emissions) |
|
Other |
They meet any additional criteria developed by the company or industry sector |
Source: Table [II] in Technical Guidance for Calculating Scope 3 Emissions
Quantification methods
Once you have identified relevant Scope 3 activities, there are two ways to measure Scope 3 emissions:
- Direct measurement – use direct emissions data obtained via direct monitoring, mass balance or stoichiometry (GHG emissions = emissions data X Global Warming Potential)
- Calculation – use activity data and emission factors (GHG emissions = activity data X emission factor X Global warming Potential).
A combination of calculation methods can be used. Different methods can be used for different Scope 3 categories, or for various activities within a particular Scope 3 category. For example, a company may use more specific methods for the activities that contribute most to its Scope 3 emissions and use less specific methods for the activities that contribute the least.
Entities should take a practical approach to reduce costs and complexity without overly compromising quality. Grouping or combining similar activity data is permitted, as well as obtaining data from representative samples and extrapolating results, and using proxy techniques.
Table [7.2] in the Corporate Value Chain (Scope 3) Accounting and Reporting Standard provides further examples of activity data and related emission factors.
Types of data
If using the calculation method, activity data can comprise primary or secondary data. Primary data is obtained from specific activities within an entity’s value chain, such as supplier data, whereas secondary data is derived from other sources such as industry-average data.
One of the advantages of using primary data is that it is more accurate, so entities should try and use it where possible. However, the disadvantages are that it may be more costly to obtain (you may need to engage with suppliers to obtain that information), and it may be difficult to verify the source and quality of data supplied by value chain partners if it has not been subject to assurance.
Scope 3 supply chain challenges
Obtaining Scope 3 activity data can be challenging because you are relying on your suppliers to provide data. You have little influence over suppliers’ data collection and management practices, and little knowledge about their data types, data sources, data quality, etc. There is also a broader need for secondary data, and therefore, assumptions and modelling.
There are also challenges in obtaining activity data from all your tiers of suppliers. Figure [7.3] in the Corporate Value Chain (Scope 3) Accounting and Reporting Standard illustrates this point. While the requirement for access to activity data and carbon footprint can be written into contracts between a reporting entity and its Tier 1 suppliers, Scope 3 emissions data may be incomplete if Tier 1 suppliers don’t have similar arrangements with their suppliers (Tier 2 suppliers to the reporting entity).
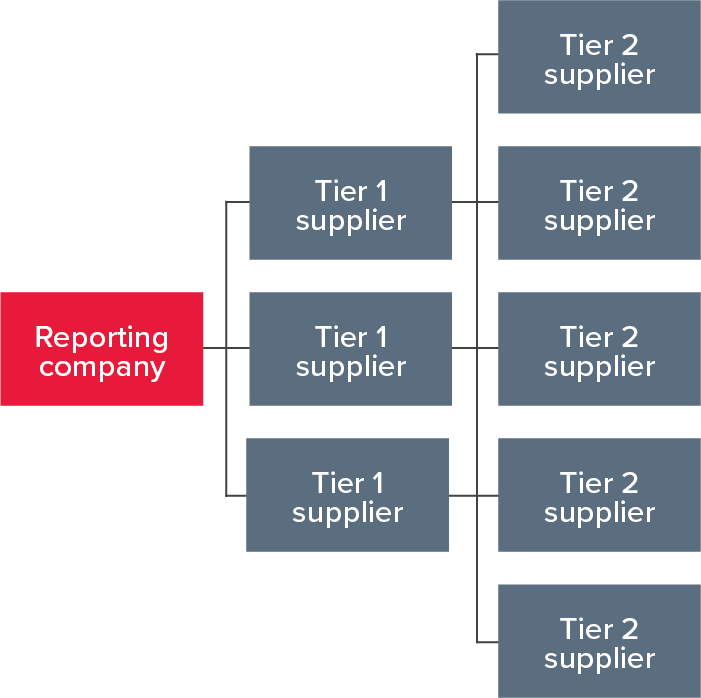
Figure [7.3] Tier 1 suppliers in a supply chain
Levels of data
The level at which emissions activity data is provided by suppliers can also affect the accuracy of your Scope 3 emissions calculations. Corporate level emissions data for organisations with diversified levels of emissions will not be as accurate as corporate level data for a homogenous organisation, where business units or facilities have similar emissions levels.
Collecting Scope 3 data
Scope 3 data must be collected for each of the fifteen categories. During our webinar, we focussed on collecting data for the first eight categories, which relate to an entity’s upstream activities. Next month, we will discuss how data is collected for downstream activities.
|
|
Category |
Description |
Examples of primary and secondary data (extracted from Table [7.4] in the Corporate Value Chain (Scope 3) Accounting and Reporting Standard) |
|
1 |
Purchased goods and services |
Extraction, production and transportation of goods and services purchased during the year, not otherwise included in categories 2-8 (‘catch all’ category) |
Primary data
Secondary data
|
|
2 |
Capital goods |
Extraction, production and transportation of capital goods (tangible and intangible) purchased or acquired during the year Note: Emissions from using capital goods is accounted for as Scope 1 (fuel use) or Scope 2 (electricity use). |
Primary data
Secondary data
|
|
3 |
Fuel and energy-related activities (not included in Scope 1 or 2) |
Extraction, production and transportation of fuels and energy purchased or acquired during the year not already accounted for in Scope 1 and 2
Examples: Upstream emissions of purchased fuels and electricity, transmission and distribution losses, generation of purchased electricity that is sold to end users. |
Primary data
Secondary data
|
|
4 |
Upstream transportation and distribution |
Examples: Air, rail, road, marine transportation, storage in warehouses, etc. |
Primary data
Secondary data
|
|
5 |
Waste generated in operations |
Disposal and treatment of waste generated in the entity’s operations during the year (in facilities not owned or controlled by the entity) Examples: Disposal of waste in landfill, recovery of recycling, incineration, composting, wastewater treatment, etc. |
Primary data
Secondary data
|
|
6 |
Business travel |
Transportation of employees for business-related activities during the reporting year (in vehicles not owned or operated by the entity) Examples: Air, rail and, bus travel, car hire, hotel stays, etc. |
Primary data
Secondary data
|
|
7 |
Employee commuting |
Transportation of employees between their homes and their worksites during the year (in vehicles not owned or operated by the entity) Examples: Car, bus, train and air travel, emissions from teleworking, etc. |
Primary data
Secondary data
|
|
8 |
Upstream leased assets |
Operation of assets leased by the entity (lessee) in the year and not included in Scope 1 and Scope 2 Examples: For leased assets not capitalised in the balance sheet under IFRS 16 Leases, such as for short-term or low value assets. |
Primary data
Secondary data
|
Want to understand more about the GHG Protocol?
You can find more information about measuring Scope 3 GHG emissions in the Corporate Value Chain (Scope 3) Accounting and Reporting Standard and the Technical Guidance for Calculating Scope 3 Emissions.
You can also register now for the remaining events in BDO's sustainability webinar series.
If you need a hand in identifying and measuring your Scope 3 emissions, our national sustainability team can help. Contact us today.